
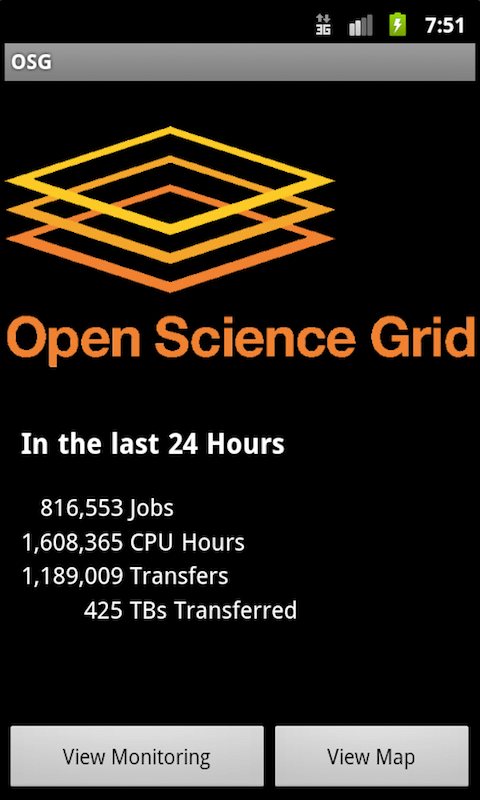
OSG… There’s an app for that
I was motivated by SuperComputing '11 coming up. My other visualization is incrementally better than last year, so I wanted to bring something new. Everyone knows the shinier the toys at SC, the better. Who knows, maybe I can use an tablet and show some cool things to people walking by.
So far, the working features are:
- Automatically updated global usage data on the home screen
- Usage queried from gratia for every site and VO
- Graphing of the usage data (though I want to work on that some)

The features I want to work on more:
- Get the map to show sites across the US. Whether it shows RSV data (boring) or usage data (slightly better), I'm not sure yet.
- Plot usage data as stacked line graph, consistent with current gratia plots.
- Get a better looking home screen. It seems too 'black'.
You can get it now on the Android market. Search for osg. It claims to support 2.2+. It works well on my 2.3.3 phone, and works in the 2.2 emulator. Please go and try it out.
Source is on github: https://github.com/djw8605/OSG-Android
DISCLAMER: This app is unofficial.
Leave a comment